
Monetize offers the option to report the campaign results, with various filters and dimensions
Run a Report
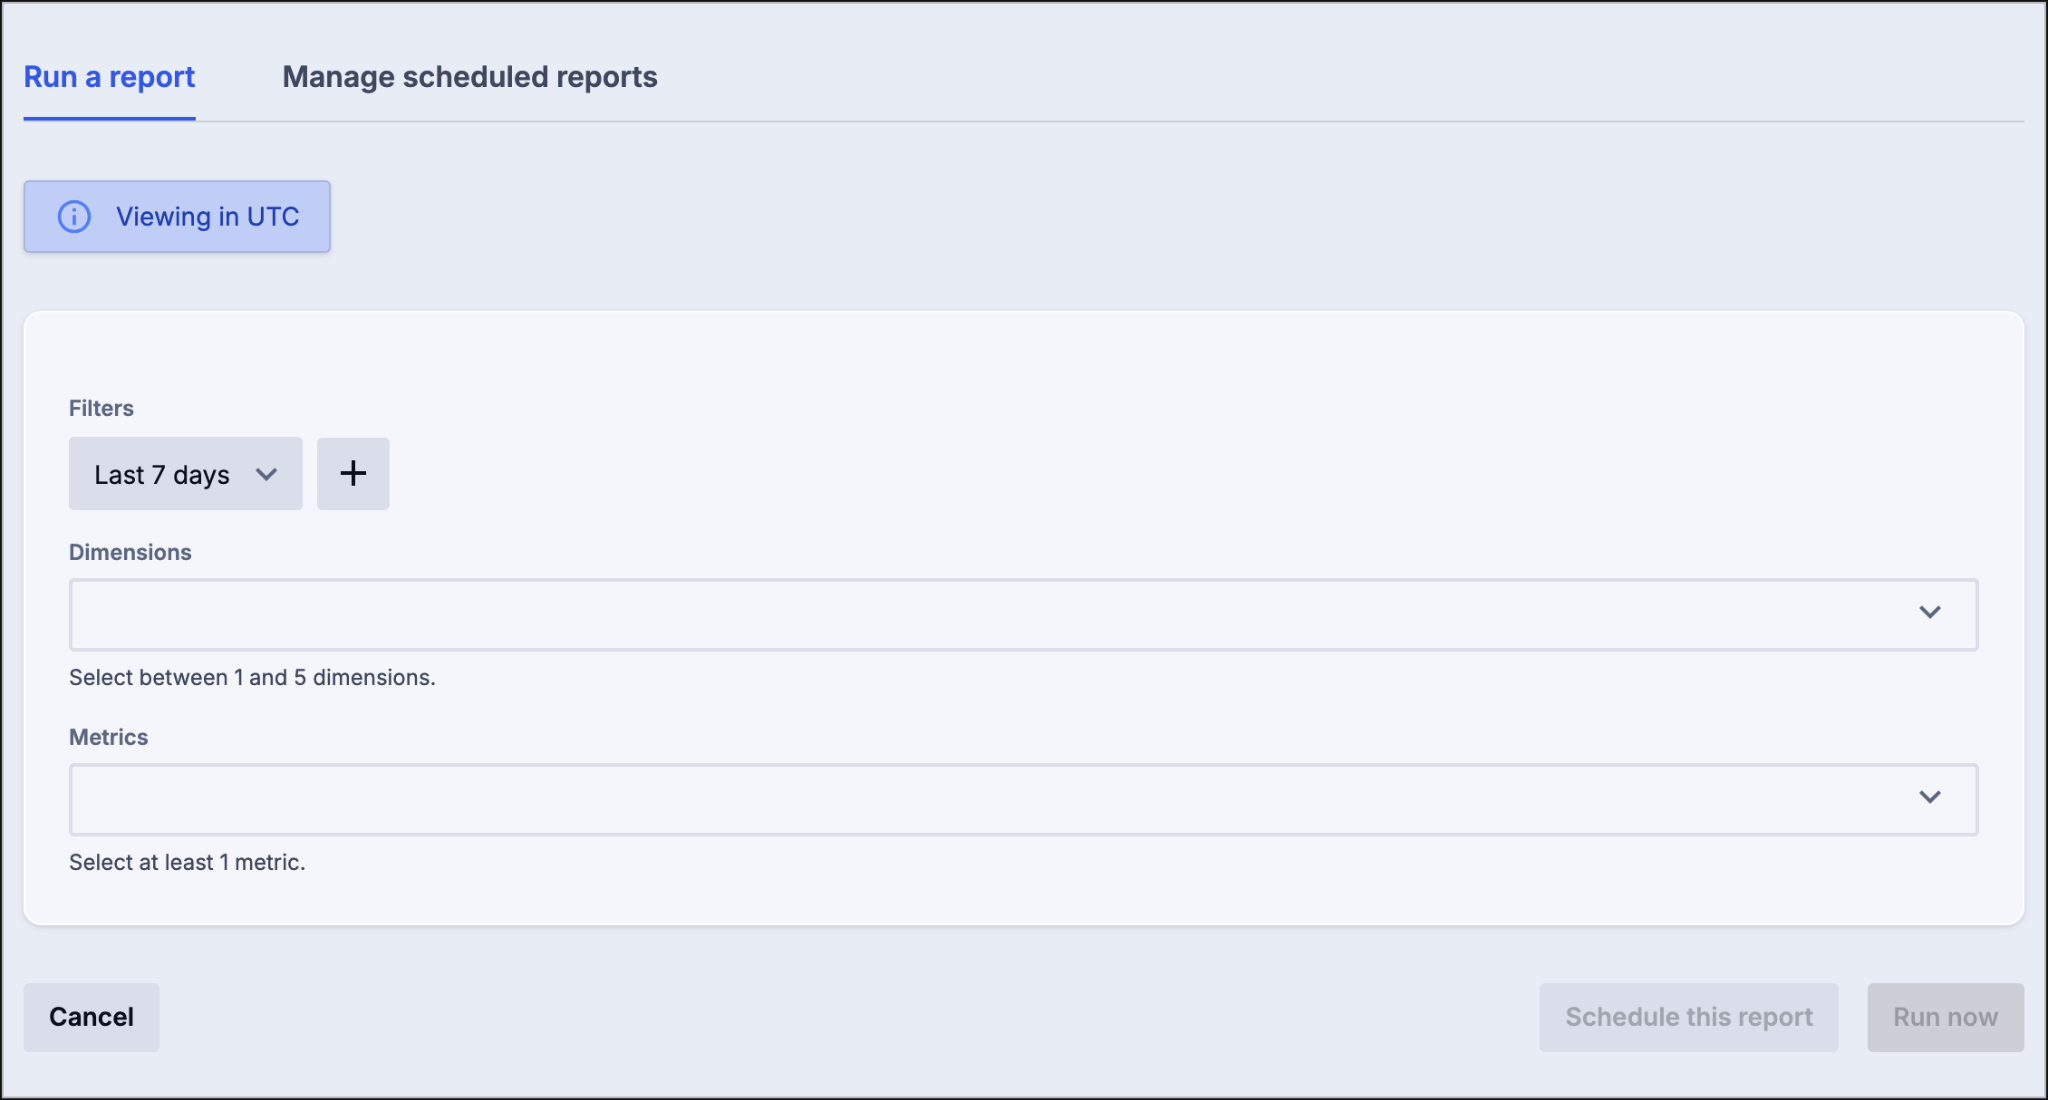
On this tab, you can set the filters, dimensions, and metrics for your report. Once you have defined the parameters of your report, you can either click Run now to generate the report immediately or schedule this report to establish a recurring report.
Scheduling Reports
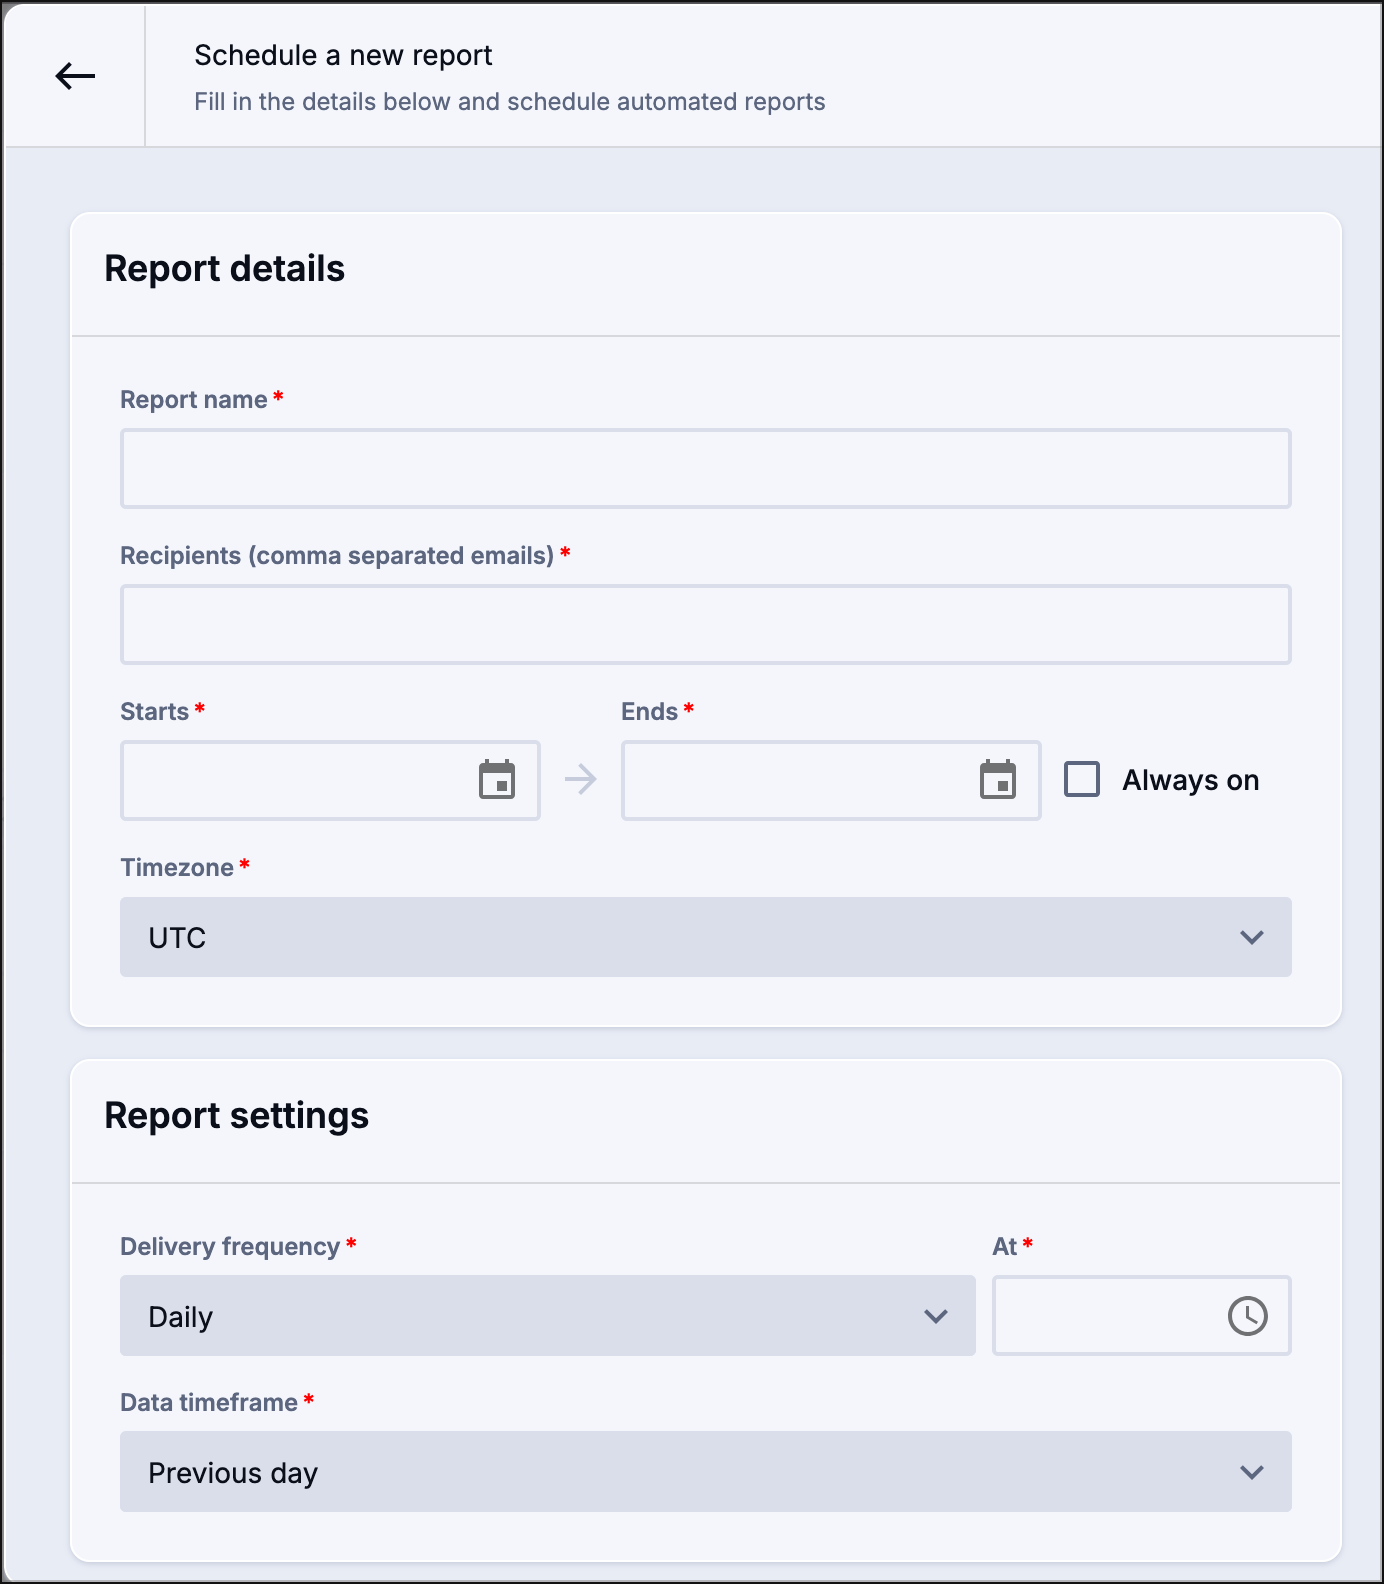
You can define a report that runs at pre-defined intervals using the Schedule a new report menu. The reports will run at the specified time and automatically email the report to your selected recipients. All fields in this menu are required in order to schedule a report.
Report Details
- Report Name: Enter a descriptive name for the report. The report name will appear in emails sent to your recipients.
- Recipients: A comma-separated list of email addresses that will receive the report when it runs.
- Starts: The date the report should first run. You can enter the date directly in mm/dd/yyyy format or select using the calendar picker.
- Ends: The last date the report will run. You can enter the date directly in mm/dd/yyyy format or select using the calendar picker. If you want the report to run indefinitely, leave this field blank and check the Always on box.
- Timezone: The time zone relative to the dates and times you set for the report.
Report Settings
- Delivery frequency: How often you want the report to run.
- Daily: Run the report at a specific time every day.
- At: The time the report should run. You can enter the time directly in hh:mm aa format or use the clock picker. Time should be entered using 12-hour time. The time is based on the timezone you selected above.
- Weekly: Run the report on a specific day or days at a specific time.
- Delivered on: Use the checkboxes to specify which days of the week you wish to generate the report.
- At: The time the report should run. You can enter the time directly in hh:mm aa format or use the clock picker. Time should be entered using 12-hour time. The time is based on the timezone you selected above.
- Monthly: Run the report one or more times each month, on a specific day or days of the month.
- Delivered on: Set the first or last day of the month under Frequently used or select the calendar date (1-31) that you wish to use to generate the report.
- Important: if you set a calendar date of 29, 30, or 31, the report will not generate on a month that does not have that calendar date. We recommend using “Last day of the month” instead of a date of 29, 30, or 31 to ensure the report is generated every month.
- At: The time the report should run. You can enter the time directly in hh:mm aa format or use the clock picker. Time should be entered using 12-hour time. The time is based on the timezone you selected above.
- Delivered on: Set the first or last day of the month under Frequently used or select the calendar date (1-31) that you wish to use to generate the report.
- Daily: Run the report at a specific time every day.
- Data timeframe: Set the lookback period for the report to determine what timeframe is used to produce the data. Important: The data timeframe you set overrides the Date Filters you set on the Run a Report page.
- Previous Day: The calendar day (midnight-midnight) immediately prior to the day the report runs.
- Previous Week: The previous full week (Monday-Sunday) immediately prior to the week the report runs.
- Previous Month: The last full month (the 1st through final day of the month) immediately prior to the month the report runs.
- Previous Quarter: The full calendar quarter immediately prior to the quarter the report runs.The quarters are:
- Q1: January-March
- Q2: April-June
- Q3: July-September
- Q4: October-December
- Last 7 days: The seven days immediately prior to the day the report runs.
- Last 30 days: The 30 days immediately prior to the day the report runs.
The difference between Delivery frequency and Data timeframe
Because Delivery frequency and Data timeframe both deal in dates and times, it may appear that they serve a similar purpose or are related in some way. They are not.
- Delivery frequency: How often the report is automatically generated
- Data timeframe: The dates used to generate the report.
For example, if you wanted to get a report every morning that shows information about what happened yesterday, you would set Delivery frequency to Daily and Data timeframe to Previous day.
However, if you want a report that comes out every week that shows what happened the prior month, you would set Delivery frequency to Weekly and Data timeframe to Previous month.
The cadence in which the reports are created and what information is contained in the reports are set independently.
Available Filters
Filters can be selected for the time frame, including:
Today, Yesterday, Last 7 days, Last 30 days, This month, Last month, or Custom date range.
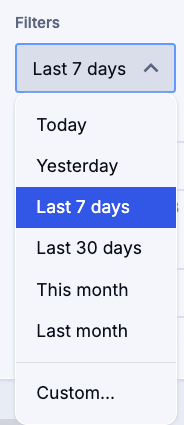
You can select additional filters by clicking the plus sign.
- Ad positions: Where in the broadcast the ad plays
- Advertisers: Include or exclude specific advertisers
- Campaigns: Include or exclude specific campaigns
- Connectors: A list of the associated demand connectors
- Countries: Include or exclude listeners from the listed countries, as determined by their IP address
- Deals: Include or exclude specific programmatic deals, defined in the Deals document
- Postal Codes: Include or exclude listeners from the listed postal codes, as determined by their IP address
- Publishers: Include or exclude any of the Publishers on your account.
- Regions: Include or exclude listeners from a specific region, as determined by their IP address
- A region can be a state, territory, province, or another area larger than a city but smaller than a country
- Supply organizations: Include or exclude any of the supply organizations that hold inventory on your account
- Zones: Filter by the ad inventory zones you established when creating your campaigns
Dimensions
A dimension is a column that appears in the final report. Select between one and five dimensions. You can sort the report by dimension by clicking on the arrow in the report. You can drag and drop the dimensions in the creation bar before running the report to rearrange the order of the dimension columns.
| Displays the Metropolitan Statistical Area for the campaign |
Metrics
A metric is a row that appears in the final report. Select at least one metric. You can drag and drop the metrics in the creation bar before running the report to rearrange the order of the metric rows.
Reports features
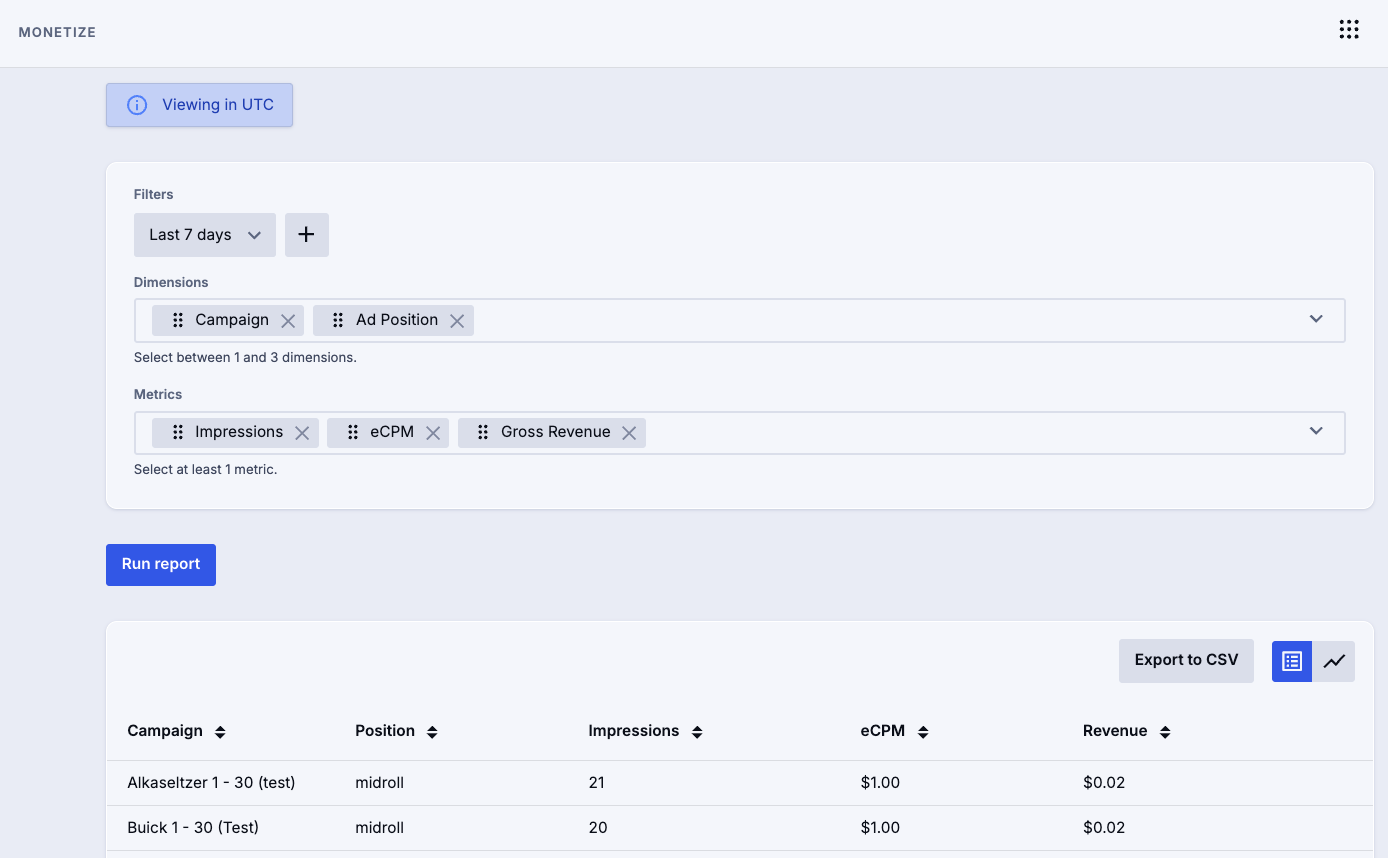
Once you select your filters, dimensions and metrics, click Run Report to generate the report.
The information in the report displays in table or chart format.
You can export your report to CSV for further analysis.
If you have any further questions or concerns, please do not hesitate to contact our Support Team through the ticket submission form or by emailing us at support@soundstack.com.