
Track your sold and available impressions to plan your upcoming campaigns
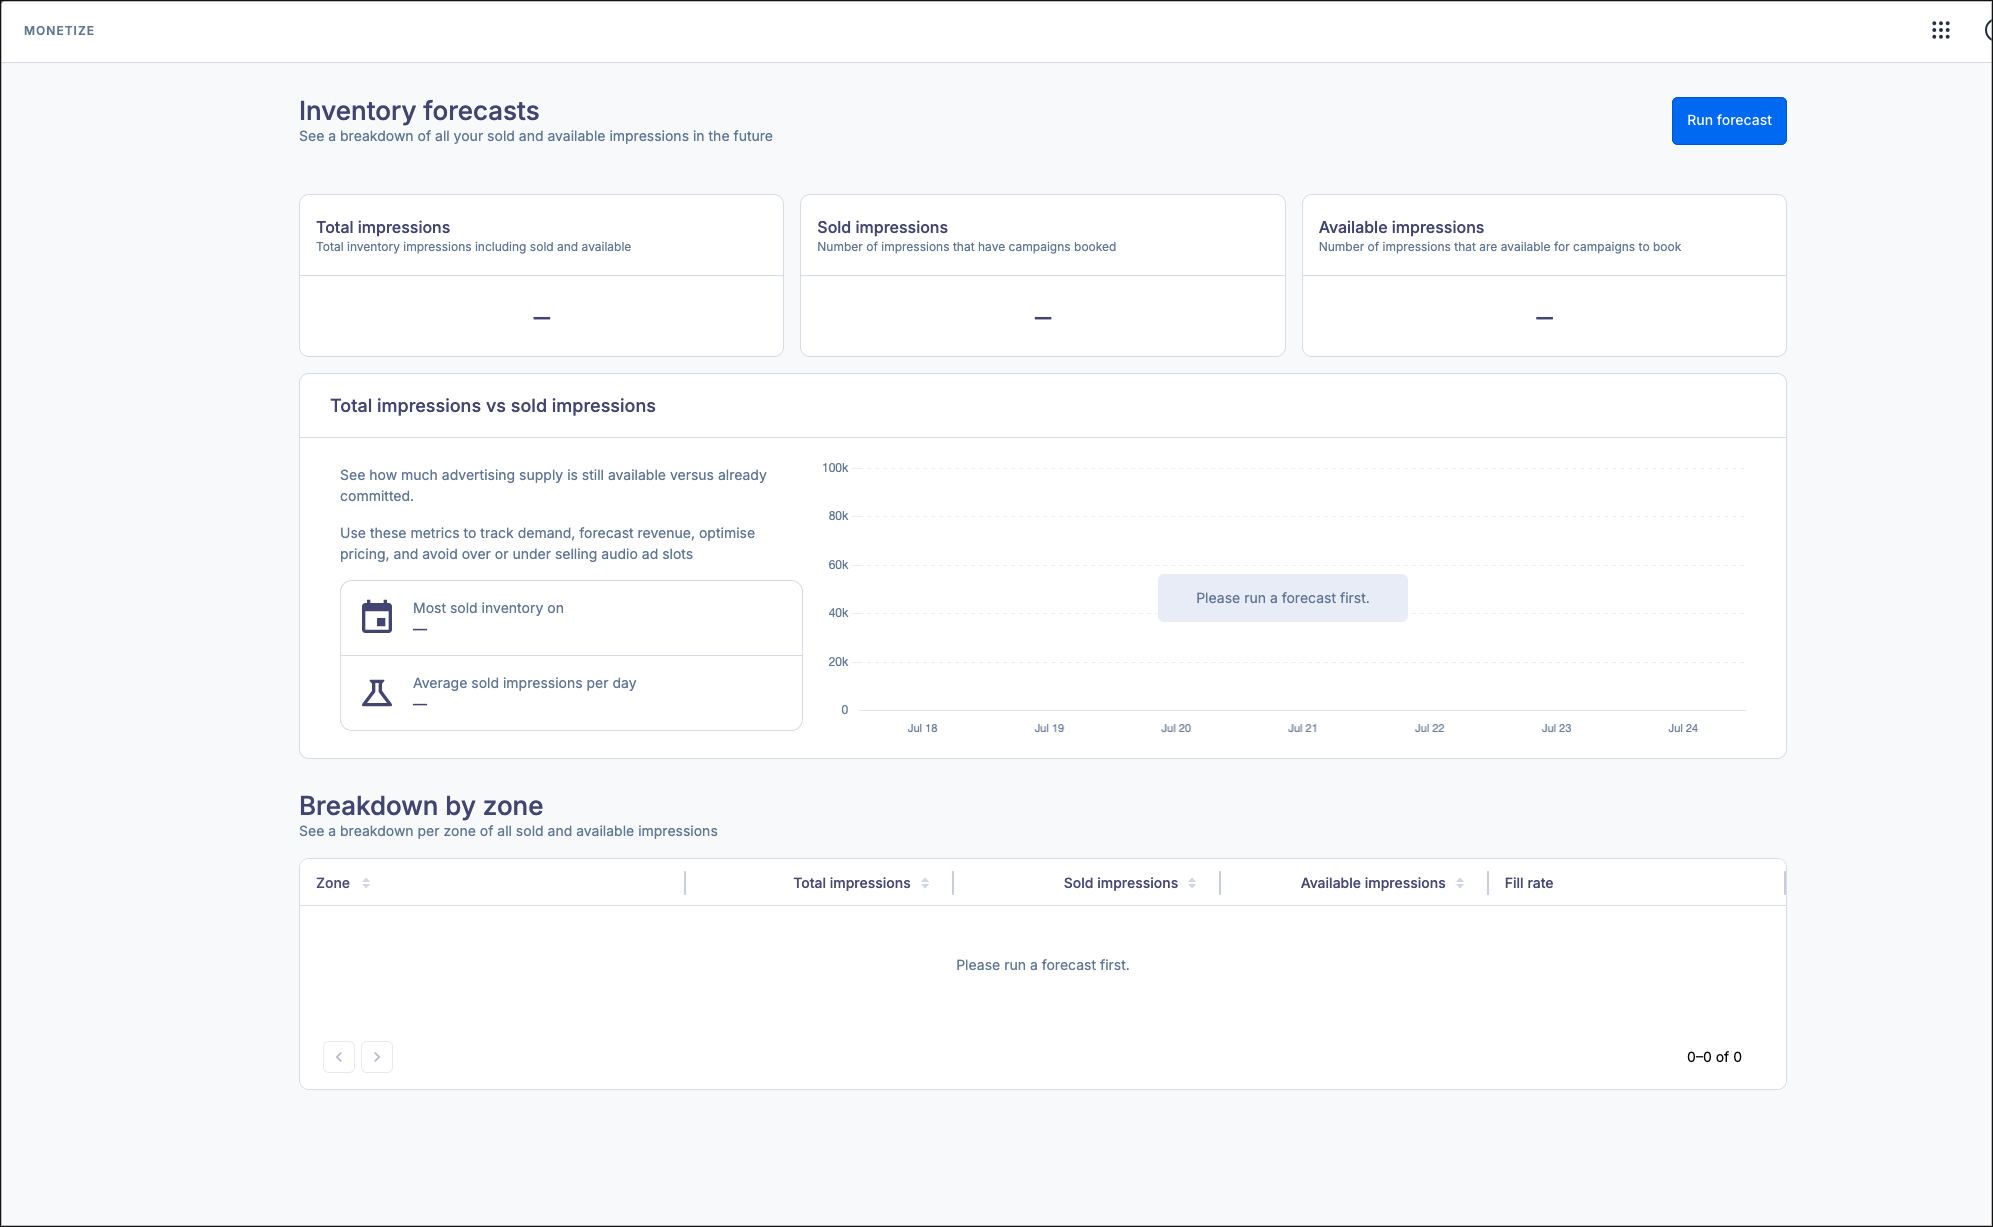
Inventory Forecast allows you to track your unsold impressions across your inventory zones. This can help you ensure that you’re selling all your available inventory without overselling any of it. SoundStack’s machine learning and predictive algorithms will generate an estimate of what your total impressions, sold impressions, and available impressions might be over the course of a specified time period.
Preparing for your First Inventory Forecast
The more of your data the predictive algorithm that powers Inventory Forecast has to analyze, the more accurate the predictions will be. Inventory Forecast requires a minimum of four weeks of inventory data to produce a usable forecast. The forecasts are most accurate after analyzing a minimum of eight weeks of data. For best results, we recommend ensuring you have used Monetize for at least eight weeks before creating your first forecast.
Creating a New Forecast
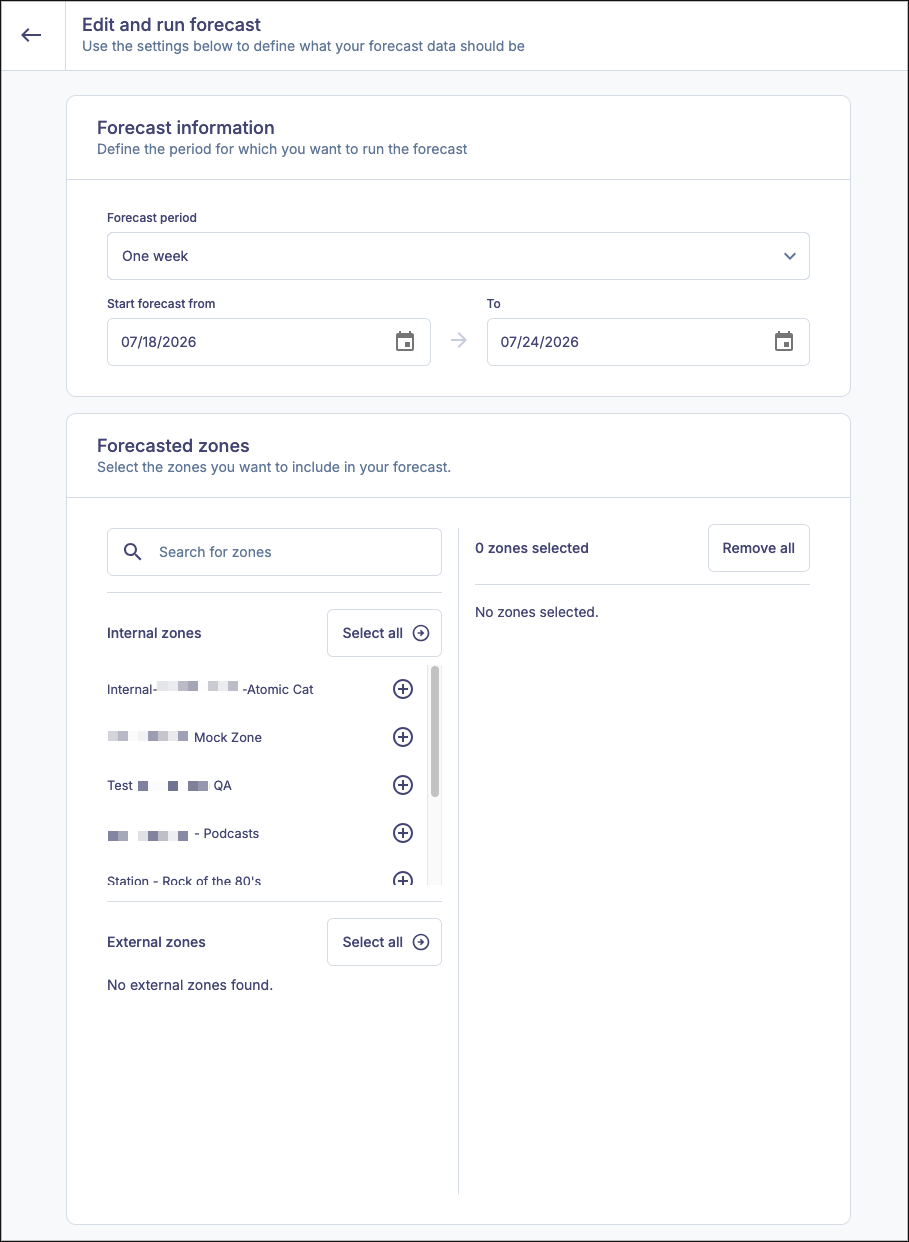
Setting the Forecast Time Frame
You can set your timeframe up to three months in the future by using the preset selections (one week, one month, three months) or set a custom date range using the custom date picker.

Any forecast further in the future than three months from the current date will return a forecast from the three-month mark.

Zone Selection
You can select which inventory zones to forecast by selecting them from the left column.
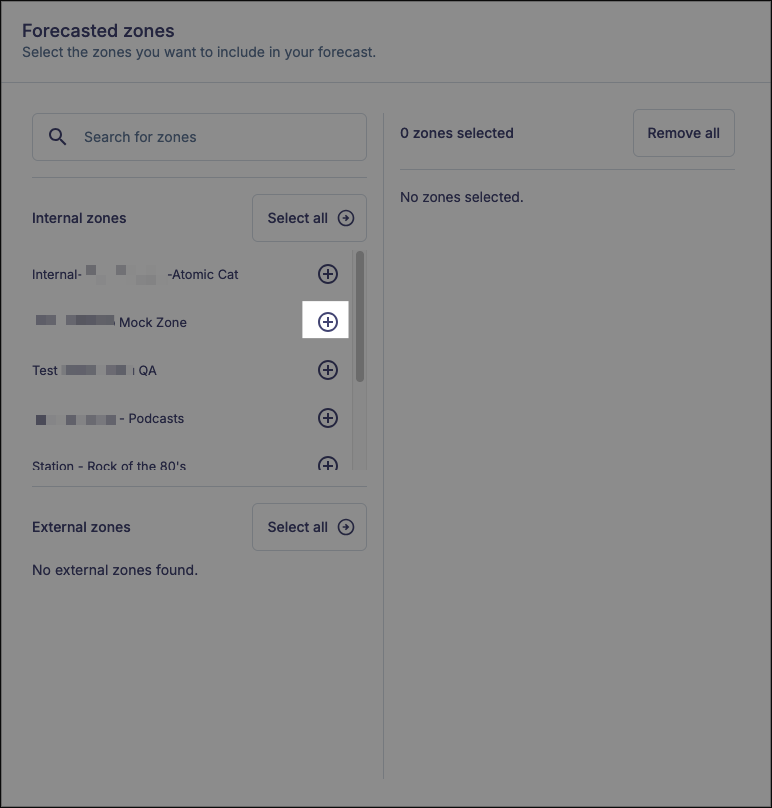
Click the + icon to add a zone to your forecast. You can search for zones using the search box in the upper part of the left column. You can also click Select all to add all visible zones to your forecast.

Searching filters the list of available zones. You will still need to click the + icon to add the zone to your forecast. Clicking Select all when filtering your zone list will only add the filtered zones to the forecast.
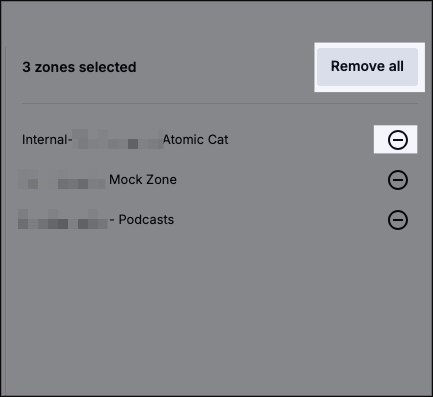
Zones included in your forecast will appear in the right column. You can remove individual zones from your forecast by clicking the - icon. You can remove all zones from your forecast by clicking Remove all.
Forecasted Audience
You can limit the forecast to a specific audience by setting one or more audience rules.
- Forecast Audience By: Set the criteria you’re using to match against.
- Country
- Region/State
- MSA: Metropolitan Statistical Area
- Device
- Platform
- Is any of/Is not any of: Used to set the logic of the forecast audience rule. Use “Is any of” when you want to select audiences that match your rules, use “is not any of” when you want to select an audience that does not match your rules.
- Value: Geography, device or platform you wish to match against your rule. Clicking on the field will open a context sensitive menu to choose your value or values. You can filter the list by typing directly into the box, but you will still need to check the box or boxes for your choice.
- Add another audience targeting criteria: You can add additional rules by clicking this link. Rules can only be joined by the AND operator, which means all rules must match to trigger the rule, but you can use a combination of “Is any of” and “Is not any of” to craft the rules you want.
- For example, if you wanted a rule to catch everyone in the USA except for people in New Hampshire, you could make the following rule:
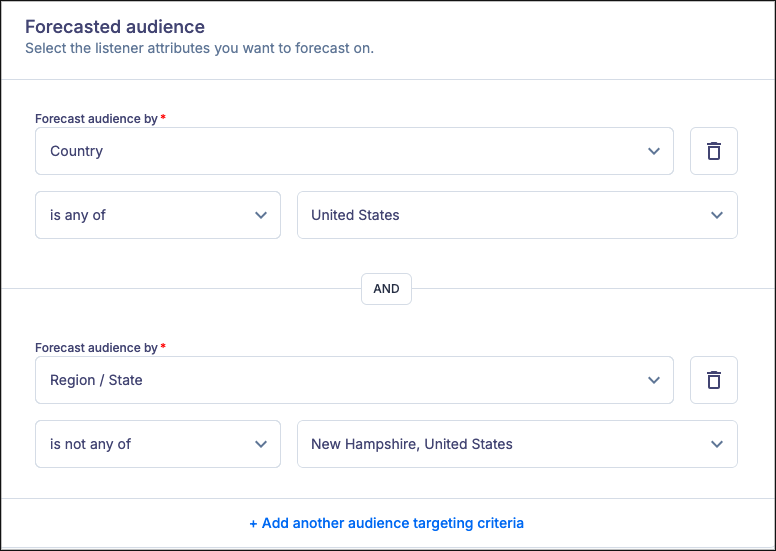
You can remove a rule by clicking on the trash can icon.
Running a Forecast
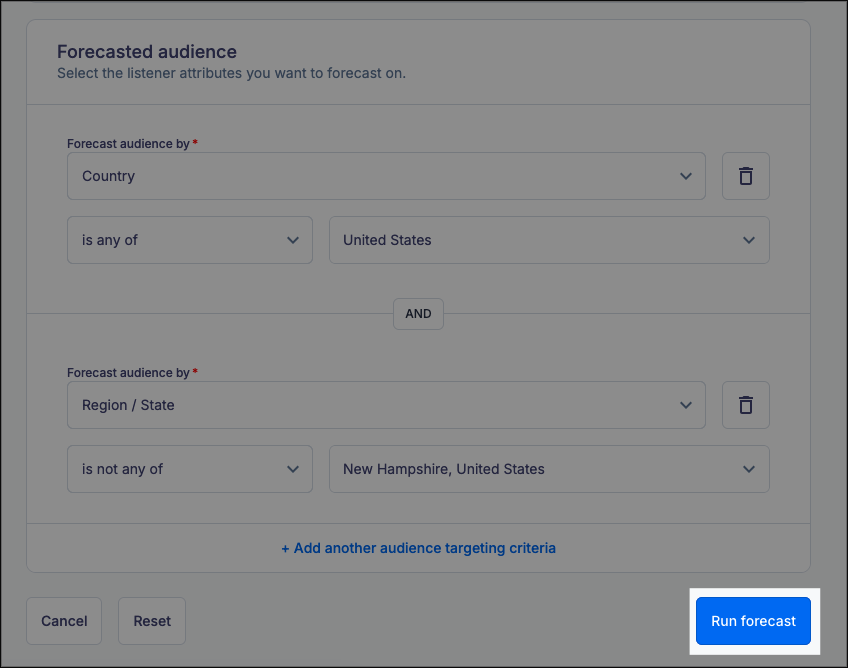
To apply your settings and create a forecast, click the Run forecast button. Any time you make changes to your forecast (adding or removing inventory zones or changing the timeframe) you must click Run forecast to see those changes reflected in your forecast.
Editing your forecast
To adjust the values of your forecast or add additional attributes, click Edit and run forecast and change your selected values.

Click Run forecast after making any changes to view the update forecast.
Resetting your forecast
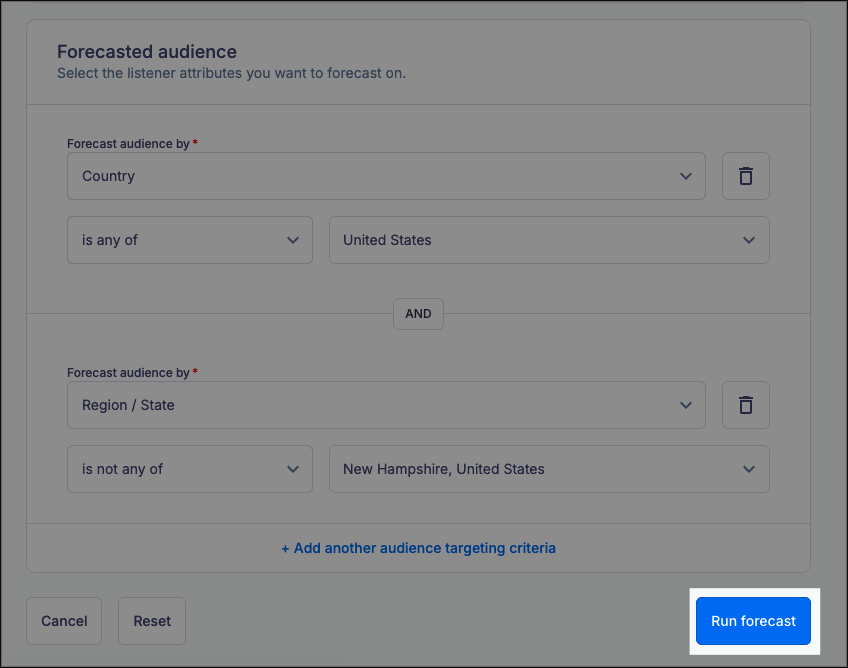
To run a completely new forecast, click Edit and run forecast, then click Reset at the bottom of the edit screen. This will restore all values to default and allow you to run a new forecast.


Viewing your Forecast
Once you click Run forecast, your results will display automatically on the forecast dashboard, until you leave the screen.
Top level forecast

You can view estimates of your total impressions, sold impressions, and available impressions from all selected inventory and audience selection at the top of the results.
Time series data
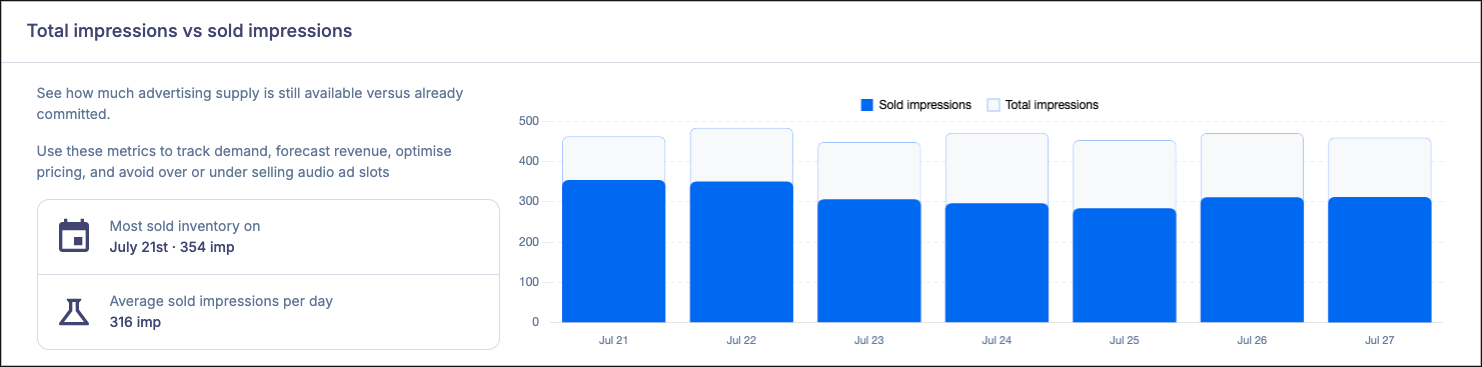
This view offers a breakdown of your forecast by day, comparing the inventory you have sold for that period against the impressions you’re likely to receive based on past performance. This gives you an opportunity to fill ads to maximize your monetization potential.
Breakdown by zone
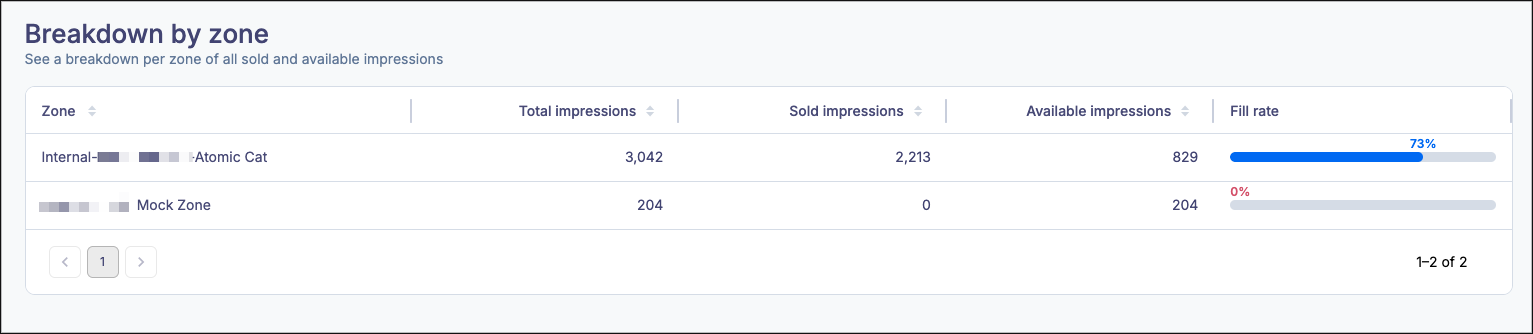
This graph provides a breakdown of your forecast by inventory zone.
- Audience Attribute(s): If you filtered your forecast based on one or more audience attributes, those attributes will appear as columns in the breakdown
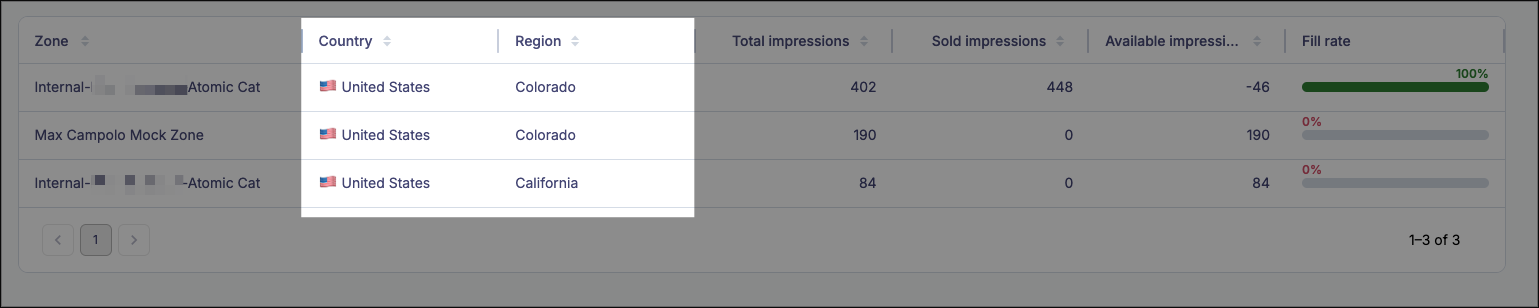
- Total impressions: A combination of available impressions and sold impressions you are likely to have during this time frame
- Sold impressions: The impressions you’ve already committed to in direct campaigns plus the number of additional impressions you are likely to sell during this timeframe
- Available impressions: The inventory that is likely to be available for sale during this timeframe
- Fill rate: The ratio of your sold impressions over your total impressions, represented as a percentage. This will allow you to predict how much of your inventory you are likely to sell during this time period.
You can sort each table by any of the metrics by clicking on the arrows in the columns.
If you have any further questions or concerns, please do not hesitate to contact our Support Team through the ticket submission form or by emailing us at support@soundstack.com.