
The monitoring page tracks ongoing issues on your streams and allows you to set automatic alerts to notify you if there’s an issue.
Accessing Monitoring
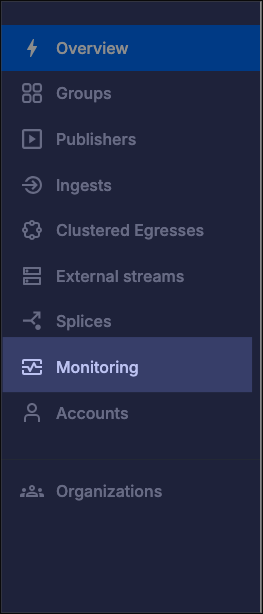
The monitoring console is accessible from the Stream application at https://stream.soundstack.com. Click “Monitoring” on the sidebar navigation to access the monitoring console.
Current Ongoing Issues
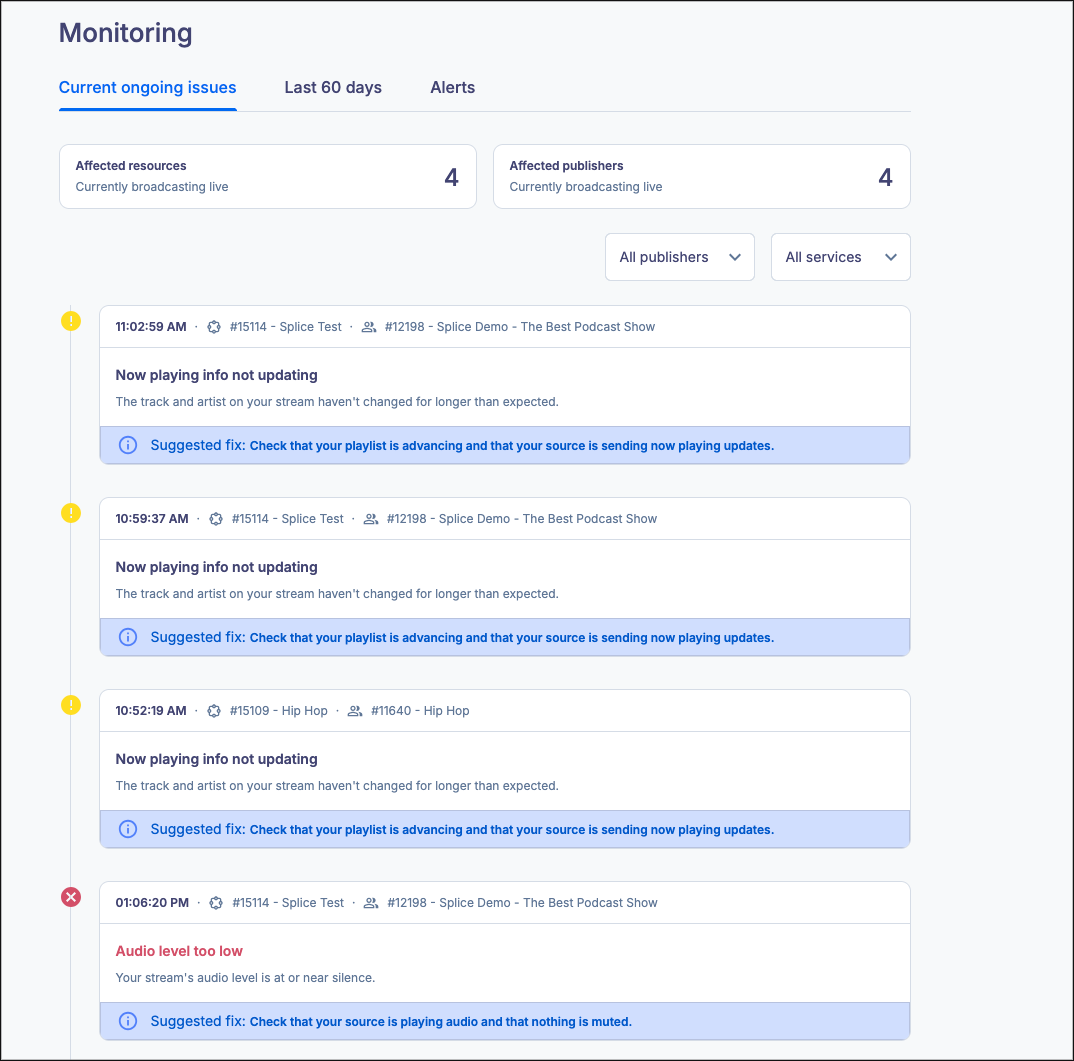
This tab lists the recent alerts that have occurred on any of your monitored streams. You can view how many publishers and streams are currently affected by these issues in the hero stats at the top of the screen.
You can filter your recent alerts by publisher or limit the alerts to ingests, clustered egresses, or both.
Alert types
- Stream URL returned an error: Your stream stopped because your source returned an error response.
- Source server error: Your source server returned an error instead of the audio stream.
- Stream not responding: We couldn't reach your stream in time — the connection timed out.
- Can't connect to stream: We couldn't open a connection to your stream URL.
- Check didn't complete: This health check didn't finish, so we couldn't confirm your stream's status.
- Audio stopped arriving: Your stream stopped because audio stopped arriving from your source.
- Running on backup input: Your primary input stopped delivering, so your stream switched to a backup input.
- Now playing info not updating: The track and artist on your stream haven't changed for longer than expected.
- Can't read metadata: We're receiving metadata from your stream but can't read it.
- Nothing connected: Nothing is currently connected to your mount point.
- Audio level too low: Your stream's audio level is at or near silence.
- Stream on hold — silence: Your stream was put on hold because it went silent.
- Check failed: This health check failed for an unexpected reason.
Last 60 Days
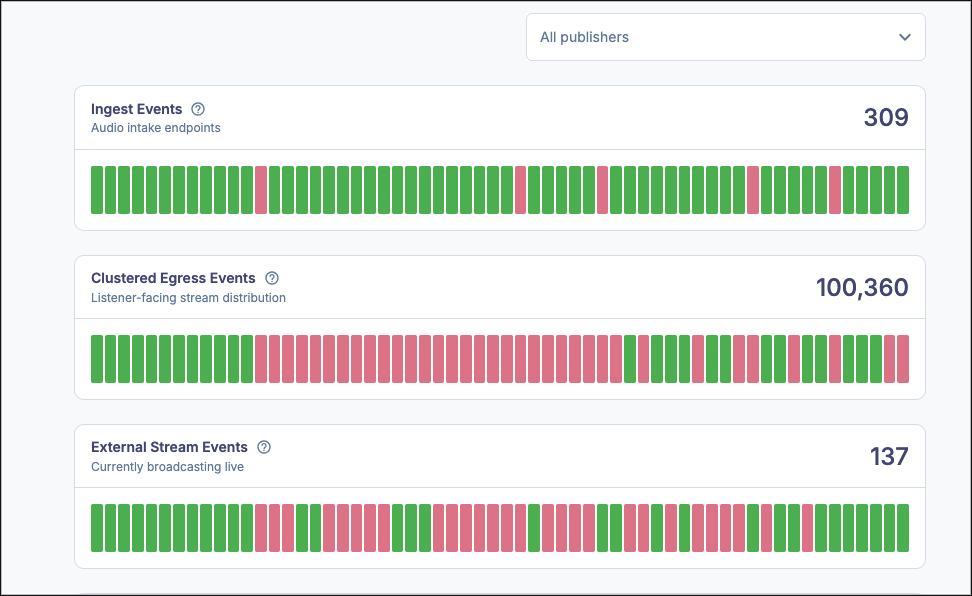
This tab allows you to view all events that have occurred in the past 60 days. It can be filtered by publisher, or you can use it to view all publisher events at once.
Each segment represents a day in the past 60 days. A green segment represents a day where no events occurred. A red segment represents a day where one or more events occurred. If a single event occurs across one or more days, it will only appear on the day the event first appeared. You can click on a red segment to view all of the events for the listed category.
Alerts
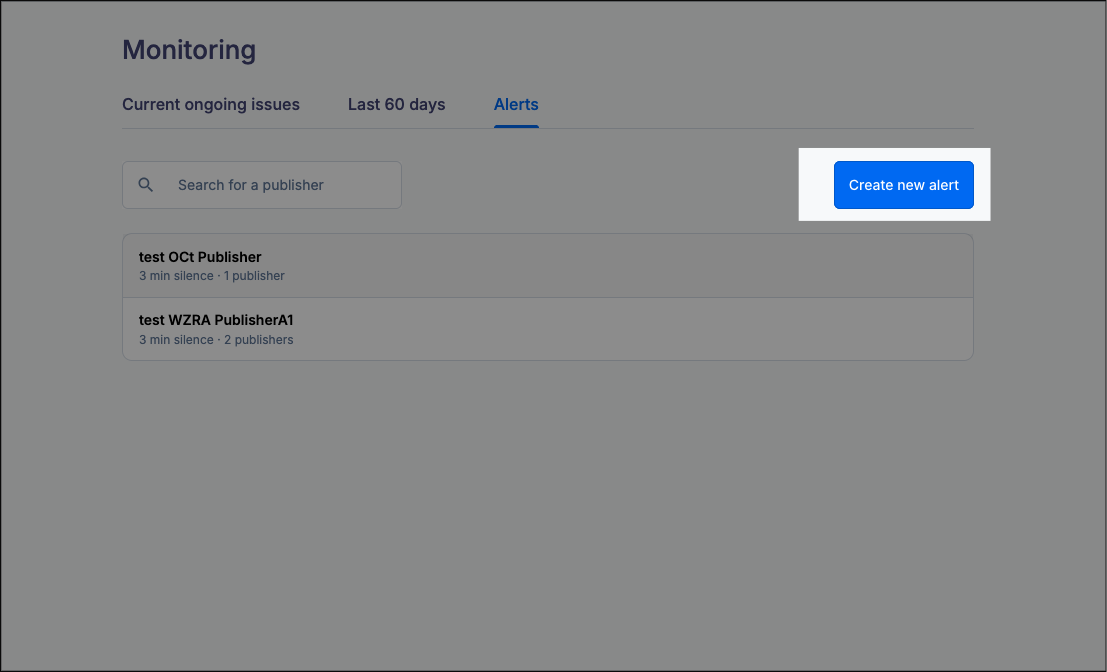
Access the Alerts screen by clicking the named button. Here, you can set the tolerance before an alert should be sent to a list of desired email addresses. This is separate from the continuous monitoring described above, and changes you make here to thresholds do not change what is flagged on the Current Ongoing Issues or Last 60 Days tabs.
Create a new alert
To create a new alert, click on the Create new alert button on the Alerts tab.
Populate the following fields to create the alert:
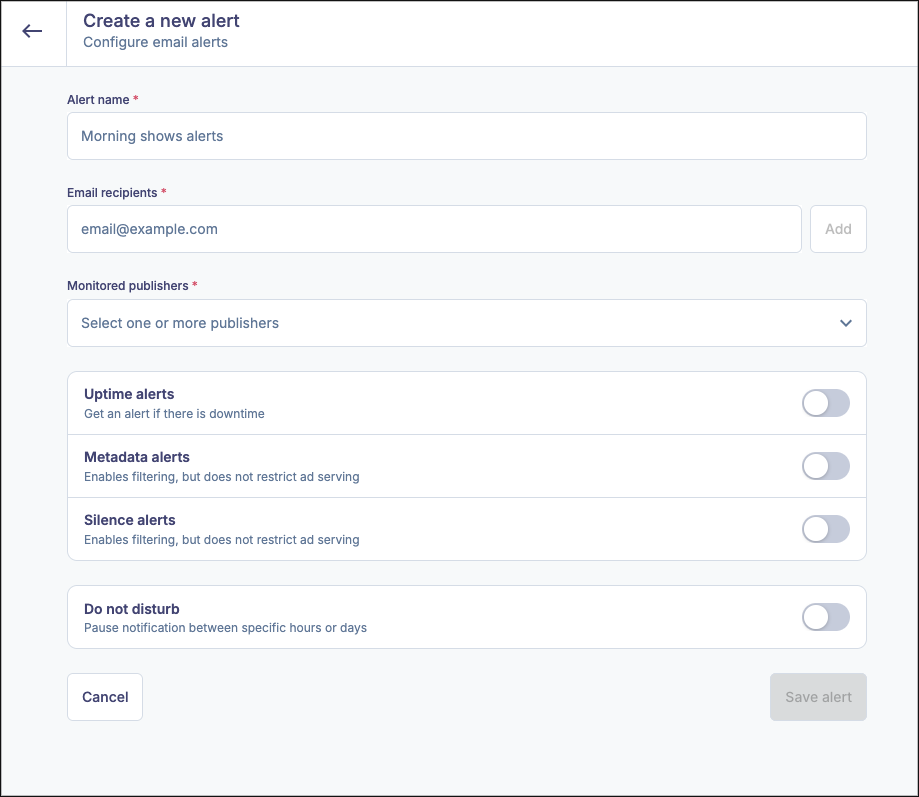
- Alert Name: This is used in the Alerts tab to reference, edit or delete the alert in the future.
- Email recipients: Enter a comma separated list of email addresses that you wish to be notified when the alert threshold is triggered.
- Monitored publishers: Select the publishers in your account that you wish to monitor as part of this alert, using the dropdown check box.
- Uptime alerts: Alerts you that your feed is “down” if the HTML request returns anything other than a 200 OK status for more time than your predefined threshold between one minute and one hour. This will inform you if your feed loses connectivity and let you know that listeners will be unable to access your stream. We recommend setting this to one minute to ensure that you’re alerted as soon as possible if your feed disconnects.
- Metadata alerts: Alerts you that the metadata is “stale” if the time since the last metadata update exceeds your predefined threshold between one minute and six hours. This will inform you if your encoder is not sending new metadata as your songs change.
- Silence alerts: Alerts you with an alarm if an instance of continuous silence exceeds your predefined threshold between one minute and one hour. This will inform you of any broadcasting issues not related to connectivity, such as a disconnected microphone or a live broadcast with dead air. This feature is exclusively available on SoundStack Dynamic Audio Server (DAS).
- Do not disturb: Pauses notifications during specific times. You can set multiple do not disturb rules to accommodate different schedules on different days. You can use this to suppress alerts during times when they are expected, for example if you’re off the air from 10 PM to 7 AM, you would not want Silence Alerts during this time.
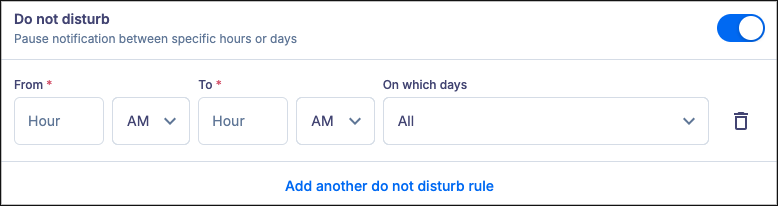
Our monitoring tool checks the station every minute. When it detects that a station is down or that the metadata has not changed, the station will be flagged and (depending on the interval) it will notify the alert recipients. For uptime, metadata, and silence alerts, the minimum alert time that can be set is 1 minute.
Email alerts
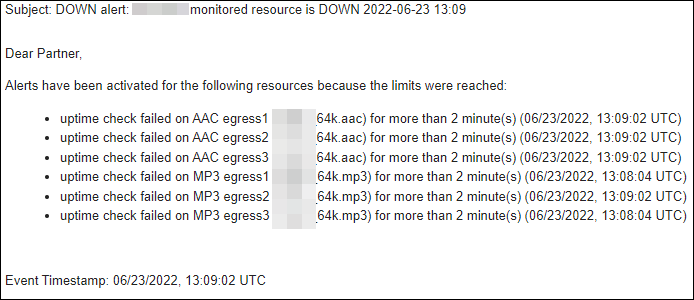
Here is what an email alert regarding streams being down might look like :
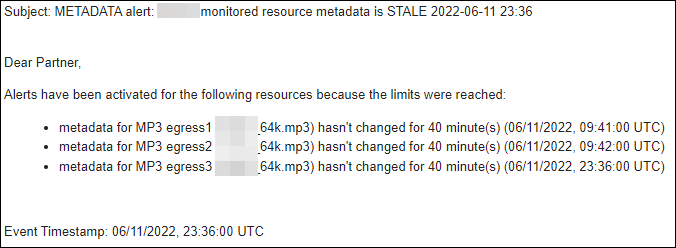
Here is an email alert regarding metadata not updating within the set tolerance point:
If you have further questions, please contact our Support Operations team by submitting a ticket here or by emailing us: support@soundstack.com.